

Running and monitoring
This page covers putting a process into production and keeping an eye on it once work starts flowing. Operating a process someone else already deployed? Skip ahead to Workflow Executions — that’s your monitoring inbox.
Deploy the process
Section titled “Deploy the process”From the process designer, click Deploy to Temporal. The platform versions the process — every deploy gets a number — and registers the trigger. For the invoice scenario that’s the invoices@yourcompany.com mailbox. The next PDF that arrives kicks off a run.
You can see the deployed version under the process’s Versions tab. Newer deploys don’t disrupt invoices already in flight: each run sticks to the version it started on.
Workflow Executions
Section titled “Workflow Executions”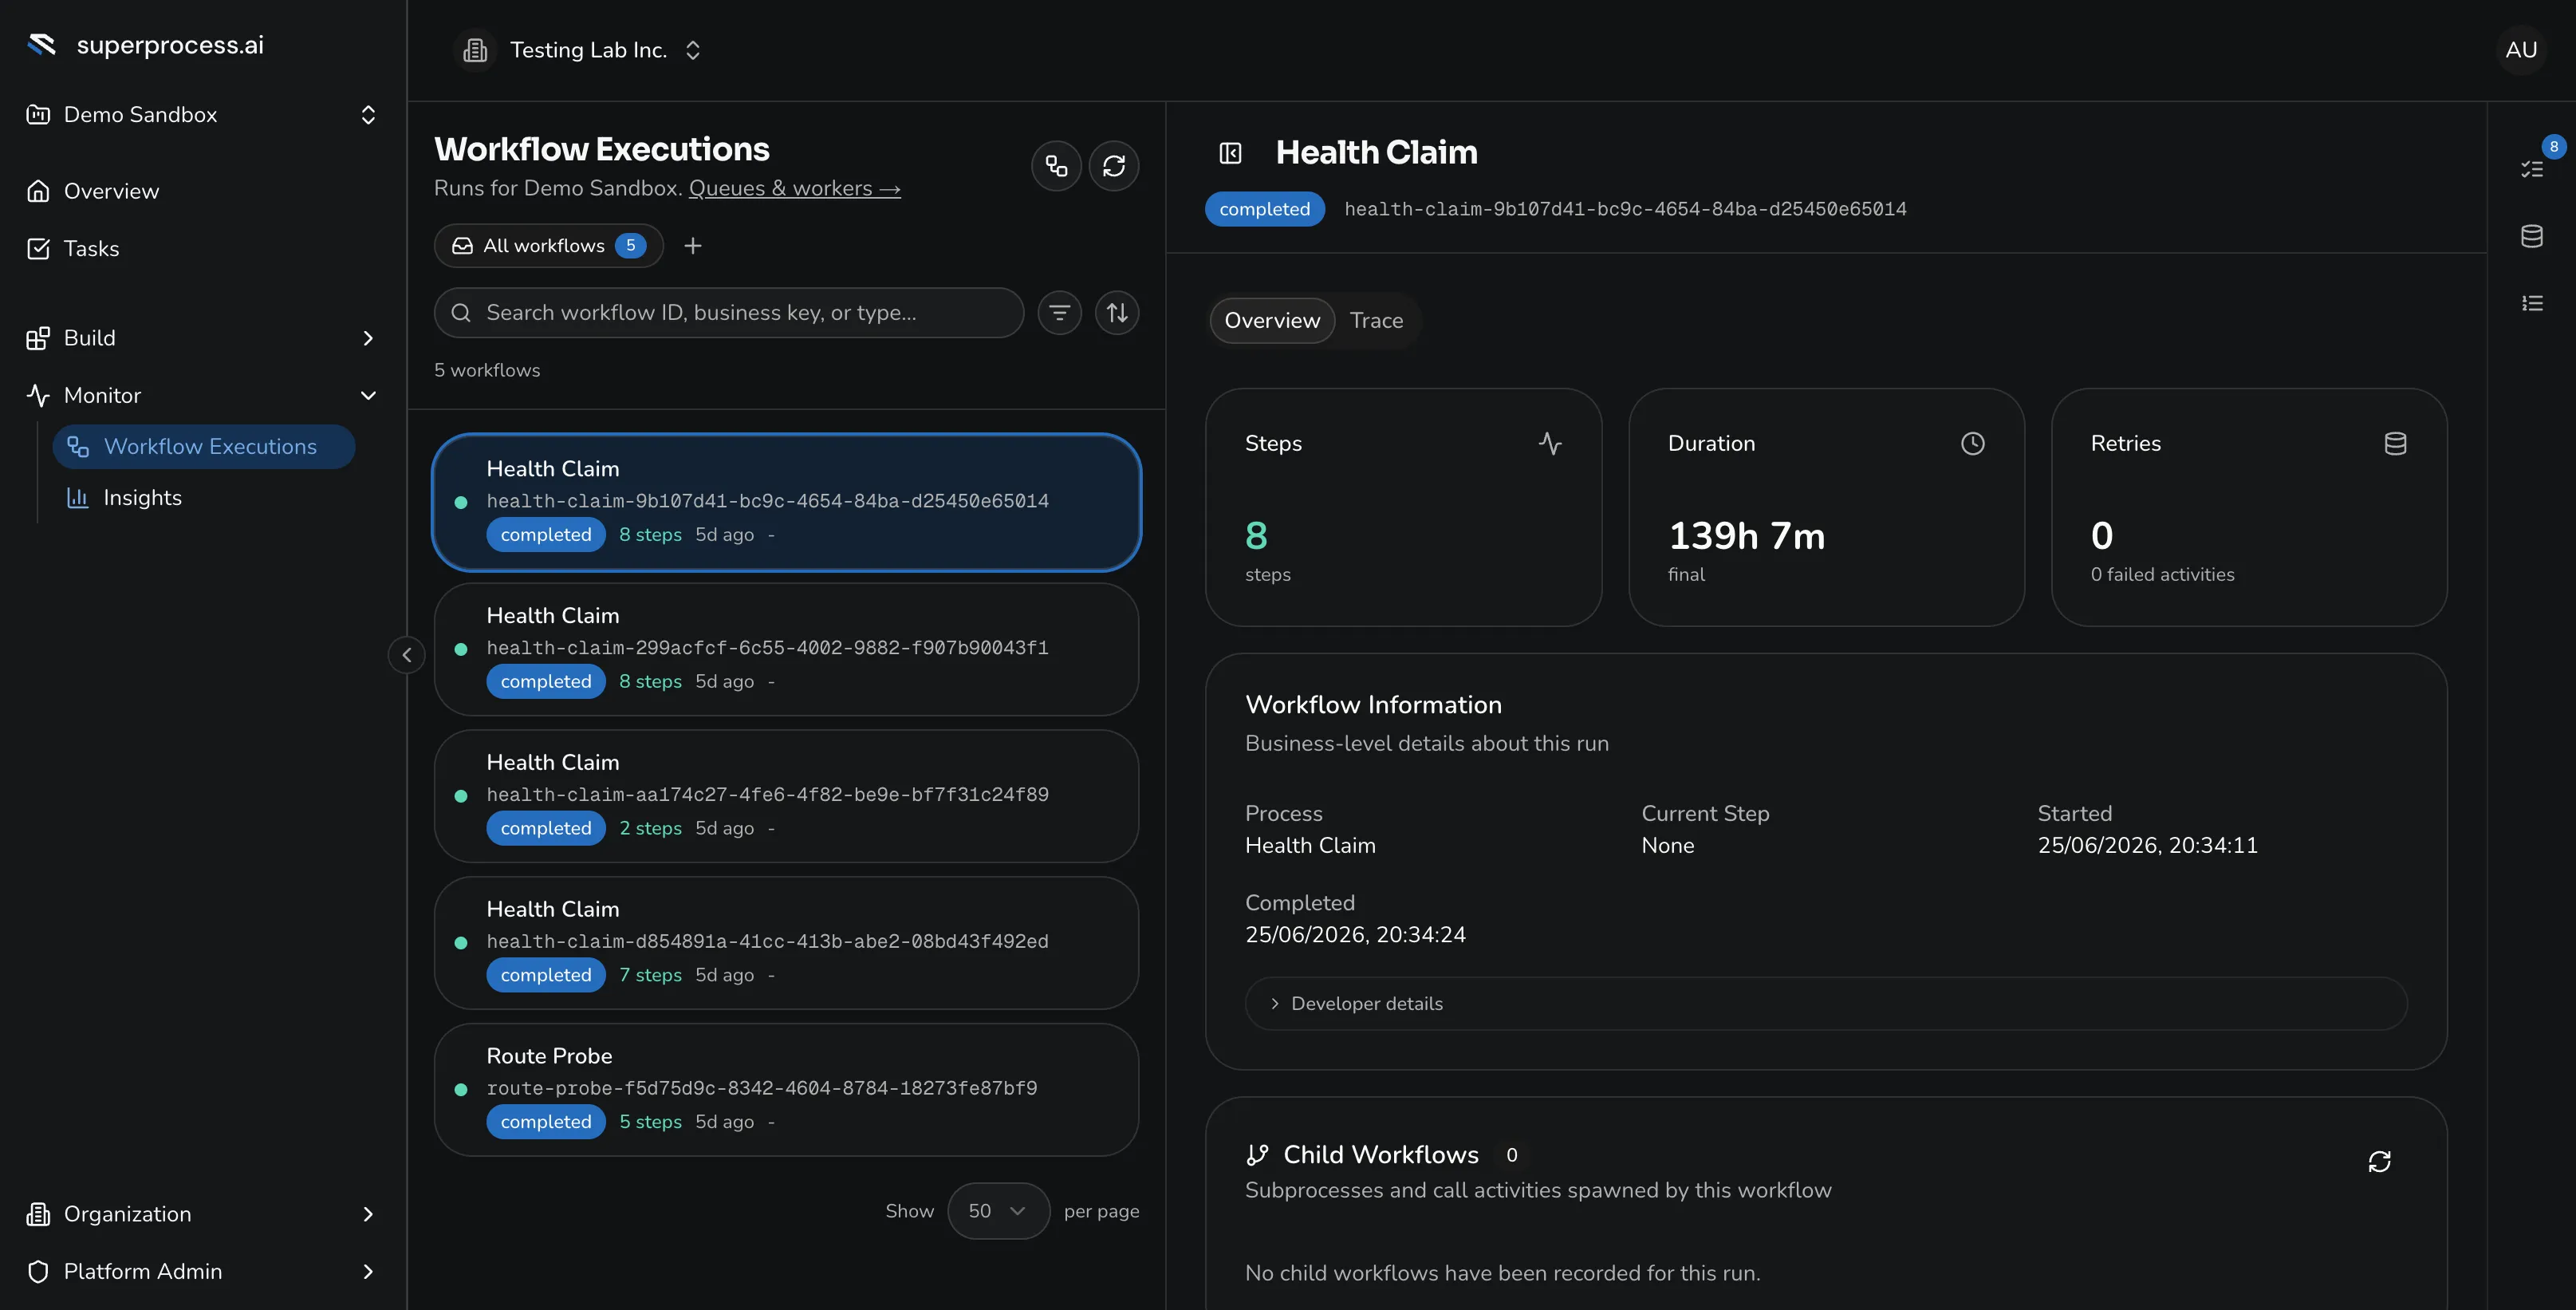
Workflow Executions (under Monitor) is your operational inbox. It’s a split view — a searchable list of runs on the left, the selected run’s detail on the right. Each row shows the process, its status (Running / Completed / Failed / Timed out / Awaiting human), how many steps it’s taken, and when it started.
- Search by workflow ID, business key, or type.
- Filter by status (multi-select), and save the combinations you use often as named views.
- Sort by newest, oldest, or duration to spot the slow ones.
- Sub-processes are grouped under their parent run, so a run that spawns children reads as a tree.
- The list is server-paginated and refreshes every few seconds, so long lists stay fast and live runs update on their own.
Inspect a specific run
Section titled “Inspect a specific run”Click any row to open its detail on the right.
- Overview — the run at a glance: steps completed, duration, retries, failed activities, and the business-level Workflow Information (process, current step, started/completed).
- Trace — a walk through the timeline of what happened: agent calls, tool invocations, gateway evaluations, signals, retries.
- Dedicated panels break out the run’s Steps, Data, the Event Log, and Errors.
For a run waiting on a human, the detail shows the task it’s blocked on.
When something goes wrong
Section titled “When something goes wrong”If a step fails — the ERP was unreachable, the agent timed out, a gateway condition couldn’t be evaluated — the run lands in Failed (or Timed out) status, and the detail surfaces the error behind a View error details link. The main recovery control is Restart, which reopens the start dialog pre-filled with this run’s input so you can run it again from the top.